Read, filter and export your maintenance metrics
Know where the work stands, what the team got done over the period, and which machines break down or cost the most.
What you will learn
- Choose the analysis period, filter the numbers and tell current status apart from the period’s numbers.
- Read overdue work, the share of work orders completed on time and the average MTTR.
- Spot the assets that break down and the ones that cost the most.
- Export a list to PDF or CSV for your monthly review.
Before you start
What it is for
A convincing maintenance review rests on numbers drawn from real jobs, not on impressions. The Reporting module computes them from your work orders, their due dates, the time and costs logged, and the downtime recorded on your assets. This lesson shows you how to read them correctly, trace a number back to the work orders behind it, and export them. Reporting is part of the Pro plan (also included in the 30-day free trial) and is available in the web app.
Key concepts
- Current status: the work not yet completed at the moment you open the page, overdue or not. These numbers do not depend on the period you pick.
- Period: the date range applied to every other number. By default, the last 30 days.
- Created and closed: a work order created last month and closed this month counts in Closed in the period, but not in Created. The % of those created now done figure only covers work orders created during the period.
- Avg MTTR: the average time between a work order’s first move to In progress and its completion. A work order closed straight from Open is not measured.
- Reliability: an asset’s Availability (share of time spent online), Failures, MTBF (average running time between two failures) and MTTR (average length of a failure) are computed from its status changes. A failure is a switch to Unplanned downtime; Planned downtime lowers availability without counting as a failure.
- Roles, by default: the owner, admins, managers, technicians, storekeepers and viewers can open reports; requesters and contractors cannot.
Step by step
Step 1: Open Reporting and set the period
In the left menu, under Optimize, click Reporting. Click the period button 1, set to Last 30 days by default. Pick Last 90 days, for example, to see a trend. The tabs 2 give five views of the same work. To try a filter, check Reactive in the Type menu of the filter bar 3: every number on the tab is recalculated for reactive work orders only.
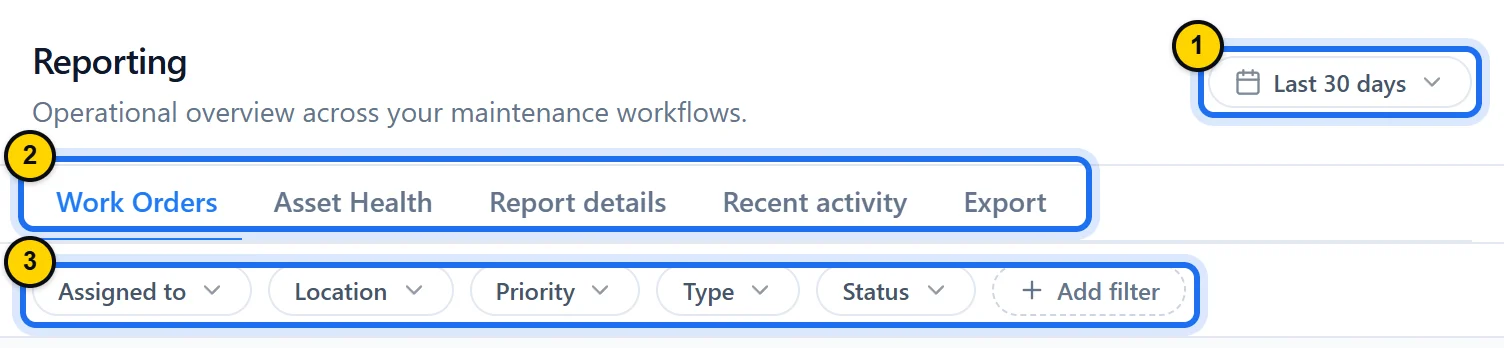
Fig. 8.1The Reporting header: period, tabs and filters.Tap the screenshot to enlarge it. - Marker 1: The period button: Last 30 days by default, or a Custom… range.
- Marker 2: The tabs: Work Orders, Asset Health, Report details, Recent activity and Export.
- Marker 3: The filters, which apply to the Work Orders and Report details tabs; Add filter also offers the asset.
TipThen remove that filter with Clear filters, which keeps the period: the rest of the lesson covers all work orders. The Assigned to filter only shows for roles that can see the user list: by default, the owner, admins and managers.
Step 2: Start with the current status
Scroll below the chart to the Current status block: it shows the work not yet completed right now, whatever period you picked. Its first three tiles split that work by status: Open Work Orders, which only counts the Open status, then In progress and On hold. Overdue 1 counts work orders past their due date: that is the first queue to clear. Due soon 2 counts those due within the next 7 days. Click any nonzero number to open the work order list, already filtered to those work orders.
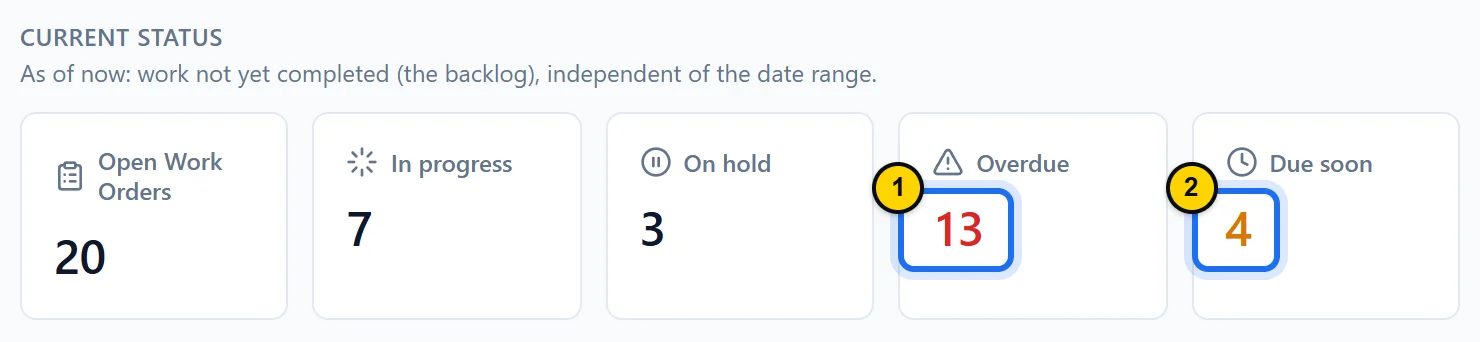
Fig. 8.2The work not yet completed, counted right now.Tap the screenshot to enlarge it. - Marker 1: Overdue: work orders not yet completed and past their due date. The number opens their list.
- Marker 2: Due soon: work orders not yet completed and due within the next 7 days.
TipThe three blocks below, Work orders by type, Priority and Assigned to, also describe the work not yet completed, not the work of the selected period.
Step 3: Compare what comes in and what goes out
Go back up to the Created or completed block, at the top of the Work Orders tab. Created 1 counts the work orders created during the period. Closed in the period 2 counts those completed during the period, even if they were created earlier. % of those created now done 3 gives the share of the period’s work orders that are already completed. On the chart, a created line that stays above the completed line means a growing backlog.
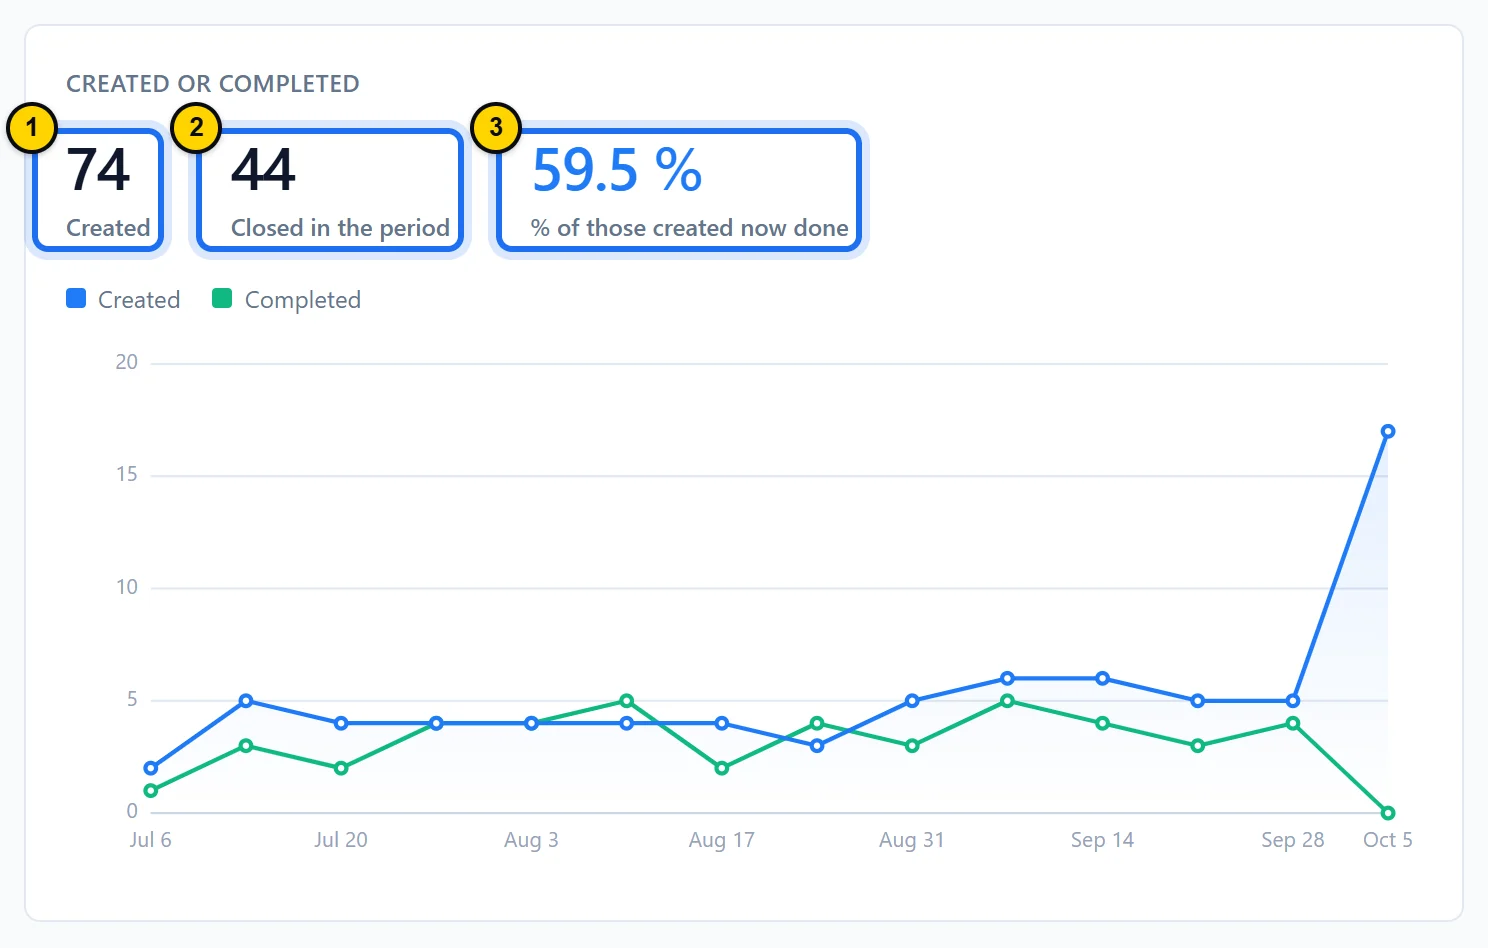
Fig. 8.3Over 90 days, the created line runs above the completed line most weeks.Tap the screenshot to enlarge it. - Marker 1: Created: the work orders created during the period.
- Marker 2: Closed in the period: the work orders completed during the period, whenever they were created.
- Marker 3: % of those created now done: of the work orders created during the period, the share already completed.
TipFor last month, choose Custom…, then fill in From and To with the first and last day of the month: your monthly reviews will always cover full months.
Step 4: Check on-time completion and repair time
At the bottom of the same tab, Over the selected period groups two performance metrics. On-time 1 gives the share of work orders completed on or before their due date, among those that had one. Avg MTTR 2 gives the average time between the move to In progress and completion. Both cover work orders created during the period and already completed. Compare them from one period to the next rather than against a theoretical target.
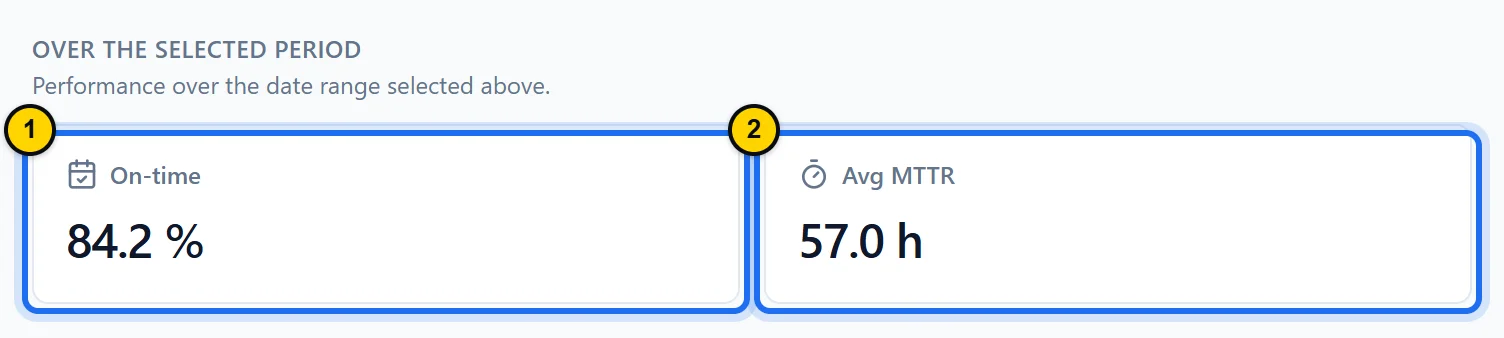
Fig. 8.4On-time completion and average repair time over the chosen period.Tap the screenshot to enlarge it. - Marker 1: On-time: the share of work orders completed no later than their due date.
- Marker 2: Avg MTTR: the average time between the move to In progress and completion.
TipA work order closed straight from Open does not count toward MTTR: ask the team to set work orders In progress when they start. With no measurable work order, the tile shows a plain dash rather than a misleading zero.
Step 5: Spot the machines that break down
Open the Asset Health tab: one row per machine, the most expensive first. The Status column 1 shows the Operational status from the asset record, and every status change feeds the reliability columns. Availability 2 gives the share of time spent Online over the period. Further right, Failures counts the switches to Unplanned downtime, MTBF gives the average running time between two failures, and MTTR gives the average length of a failure. Planned downtime, like the chiller’s, lowers availability without counting as a failure.
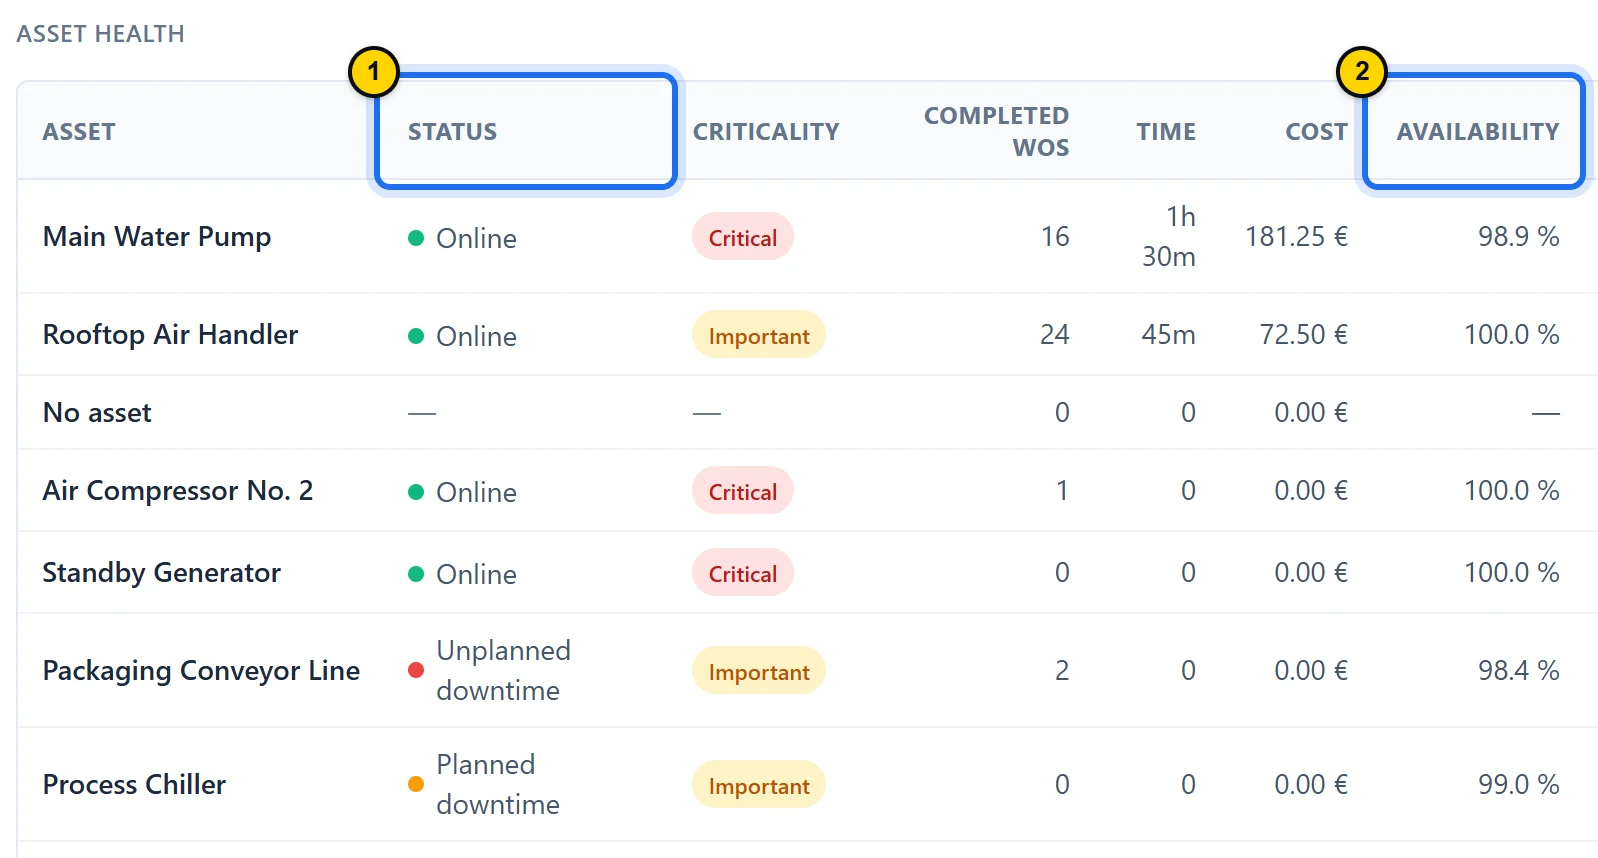
Fig. 8.5The first columns of the table: each machine’s status, cost and availability, here over all time.Tap the screenshot to enlarge it. - Marker 1: Status: the machine’s current status, Online, Planned downtime or Unplanned downtime.
- Marker 2: Availability: the share of time spent Online over the period.
TipThe reliability columns only reflect recorded downtime: a breakdown that was never recorded as Unplanned downtime on the asset record leaves the machine at 100% availability. Hover over a value in the Downtime column to see planned and unplanned downtime separately. The No asset row groups work orders that are not linked to any machine.
Step 6: Break down time and cost
Open the Report details tab. In the drop-down menu at the top right 1, choose Time & cost. Next to Grouped by:, click Asset 2. Each row gives the Time logged, the Labor, Parts and Other costs, then their Total 3. Group by User to see the time and costs of the work orders assigned to each person (a shared work order counts in full on each person’s row), or by Location to compare your sites.
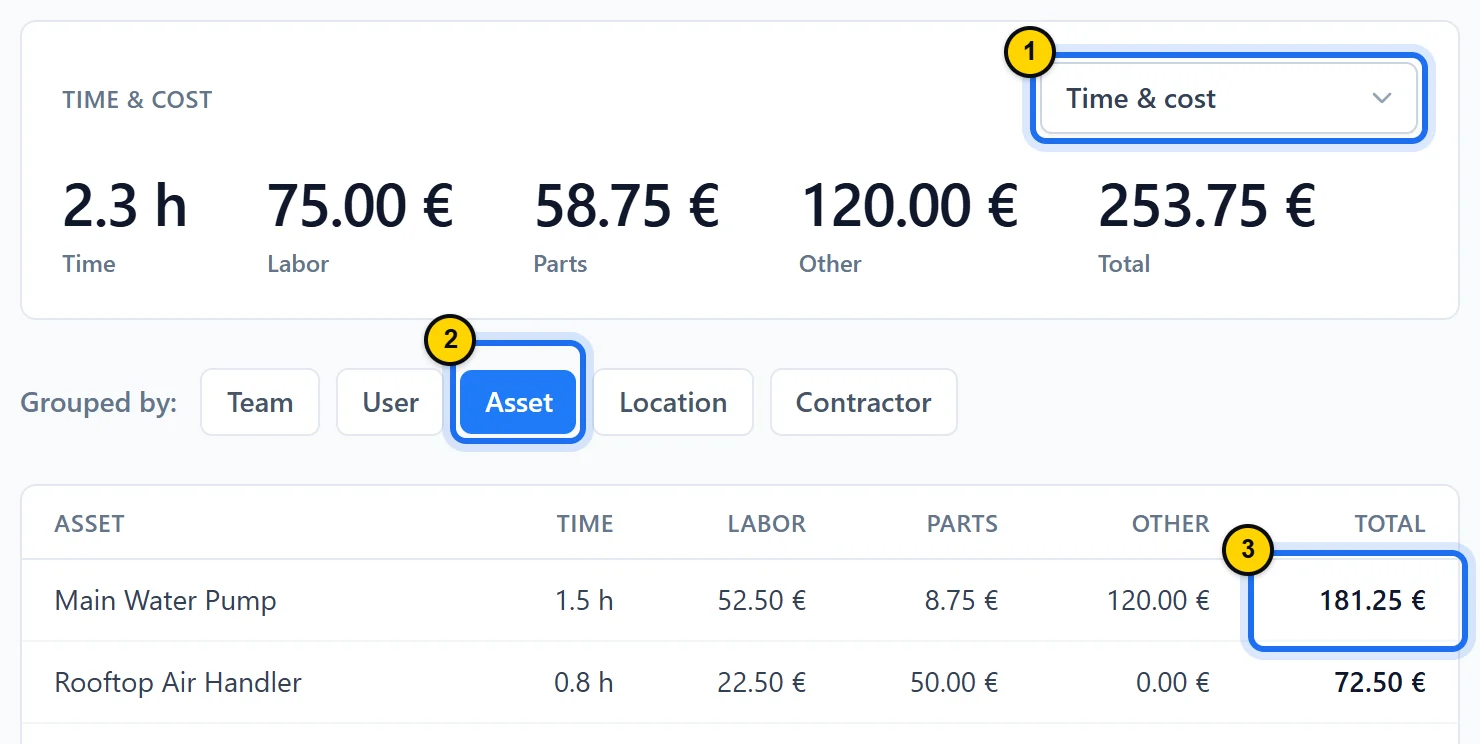
Fig. 8.6Each machine’s cost, broken down into labor, parts and other costs, here over all time.Tap the screenshot to enlarge it. - Marker 1: The report drop-down: here, Time & cost.
- Marker 2: Grouped by: Asset, one row per machine.
- Marker 3: Total: 181.25 € for the Main Water Pump.
TipOver a given period, costs only count work orders completed during that period. With All time, there is no date filter: work not yet completed is counted too. In a report grouped by User, a colleague’s labor cost is only visible to the roles that hand out work (by default, the owner, admins and managers); everyone else sees only their own.
Step 7: Export for your monthly review
Open the Export tab. Activity lists follow the period you picked 1, such as Work orders (list) or Time & cost; reference lists, such as Assets, are complete. Each card downloads as a PDF, ready to print, or as a CSV, to open in a spreadsheet 2. Only the cards for modules your role can open are shown.
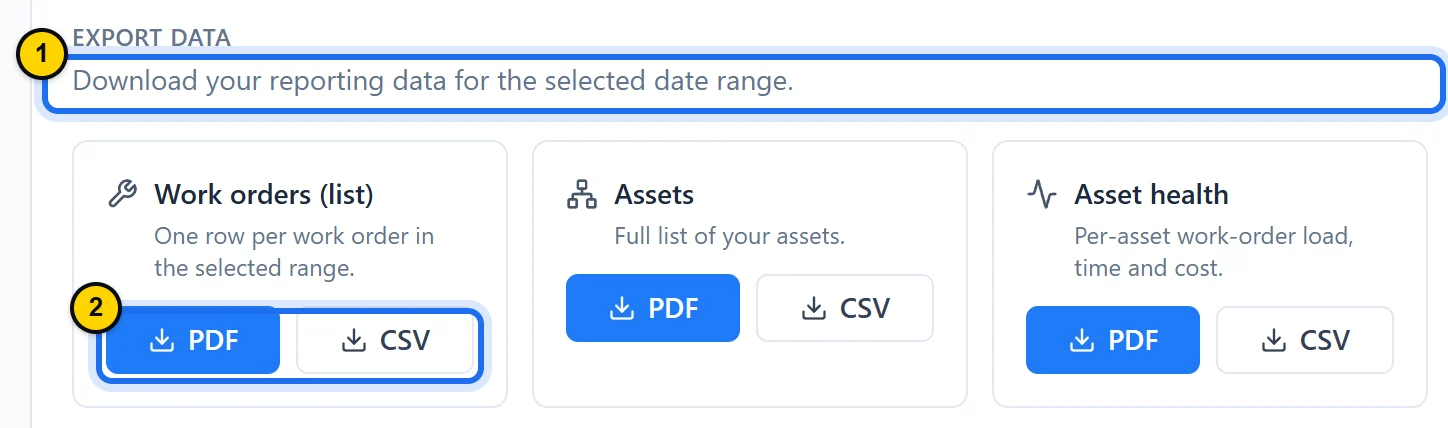
Fig. 8.7One card per list, to download as PDF or CSV.Tap the screenshot to enlarge it. - Marker 1: The period you picked applies to the activity lists.
- Marker 2: PDF to print, CSV for a spreadsheet.
TipKeep the same routine every month: same tabs, same kind of period, same exports. Numbers compared month over month say more than a single figure.
Good to know
- The Recent activity tab lists the last 10 actions recorded during the period, such as time logged or a part used, with a link to the work order.
- The page URL keeps the tab, period and filters: bookmark it, or send it to a colleague so they open the same tab with the same period and filters.
- The Work orders by type pie chart describes the work not yet completed. For the preventive share among work orders created over the period, open Report details and choose Work orders by type: the Preventive ratio figure gives that share, and the column of the same name breaks it down by group.
- The Avg MTTR on the Work Orders tab measures how long jobs take; the MTTR in Asset Health measures how long recorded breakdowns last. Do not compare the two.
- Accurate numbers depend on three team habits: set the work order In progress when starting, log time and parts, and record every breakdown on the asset record.
Key takeaways
- Current status shows the work not yet completed; every other number follows the period you pick.
- A current-status number opens the list of work orders behind it.
- Reliability and costs are read machine by machine, then exported to PDF or CSV.
Module overviewReports & KPIs →